


.jpg)
.jpg)


.jpg)
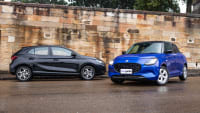


You might think we'd be an after-thought when it comes to car companies. With a population so small that there are more new cars sold in China each year than there are people in our country, how important could the car market share in Australia be anyway?
Taken as a raw number? Not very. But per-capita? That's where the story gets interesting. It makes our car market a genuine world player. In fact, new car sales figures in Australia sometimes beggar belief. Yes, car sales in Australia have been in something of a freefall over the past 18 months or so - and 2019 was a particular annus horribilis - and yet even now we're punching well above our weight when it comes to cars sold per person.
How many cars are sold in Australia each year?
Need proof? Ok, consider this analysis; we have purchased near-enough 1.1 million cars every year for the past seven years. Even in 2019, when sales dipped by 7.8 per cent to their lowest level since 2011, we STILL purchased 1,062,867 new cars.
If you're keeping score at home, the Australian car sales figures for 2011 tallied 1.008m, then 1.112m in 2012, 1.36m in 2013 and 1.113m in 2014. And they just kept growing; the Australian car sales figures in 2015, 2016, 2017, 2018 and 2019 totalled 1.155m, 1.178m, 1.189m, 1.153m and 1.062m, according to offical Australian car sales figures.

All up, the new car sales figures in Australia add up to more than 8.0 million new cars in just seven years. In a country of 24 million people. Meaning more than 30 per cent of our population bought a brand-new vehicle in the same amount of time it takes for Kia's new car warranty to run its course.
Incredible, right? And even more so when you start crossing off the people who don't actually drive (the elderly, children etc). No such data exists, I'm afraid, but you could easily imagine that those car sales statistics in Australia would climb to over 50 per cent of the population with all the non-drivers taken into account. In fact, ABS data released in 2017 found that there are 775 motor vehicles per 1000 people in Australia.

And the Australian car sales figures for 2019 proved our new car market, while slowing, remains about on-par with our now regular annual seven-figure feat. But while it might appear like business as usual, peel back the raw numbers and there are some worrying trends emerging. For one, in the 12 months to Decemver 2019, our new car sales dipped by almost eight per cent. That in itself isn't worrying, except that 2018 figures were down on 2017, which were down on 2016 figures, too.
It shows a downward trend in the new-car market, and one that has spanned several years. And many fear the worst is yet to come, with stagnating wage growth and an effective retail recession pushing consumer confidence ever lower.
Top selling cars in Australia
Again according to data from UBS, collated by GoAuto, the number of premium or luxury cars sold has skyrocketed since the year 2000 (growing at some 6.6 per cent per year). In 2000, for example, premium and luxury cars made up 18 per cent of the total market. In 2018, that number was 35 per cent.
But those numbers are now changing. While the mainstream market is mostly holding strong (well, it's dropped slightly), it's the former luxury darlings of the new-car world now taking the biggest hit.
Breaking down Australian car sales statistics by manufacturer reveals Audi's sales are down 11.8 per cent so far this year, with Land Rover (down 23.1 per cent) BMW (down 2.4 per cent), Mercedes-Benz (down 13.1 per cent), Lexus (down 0.2 per cent) all feeling the pain.
In fact, of the major premium brands, it's really only Alfa Romeo that has recorded positive growth year on year, owing mostly to the small base expected of a recently launched brand.
The pain of those numbers isn't yet reflected in our top mainstream brands, with almost every one of them either maintaining their results or reporting year-to-date growth in the crowded Australian automotive market.
Car sales by brand in Australia
The list of Australian car brands that shift the most units feels like it has been much the same since Moses got his L-plates (well, except for Holden and Ford). And 2018 was no different, with Toyota maintaining its place at the top of the table by shifting a total of 217,061 vehicles, 0.2 per cent more than the 216,566 units sold in 2017.

Mazda holds second place with 111,280 units sold, under the 116,349 sold in 2017. And it's a similar story for third-placed Hyundai, with 94,187 - nearly close to the 97,013 sold in 2017.
Spot number four is held by Mitsubishi, with the Japanese brand moving a very healthy 84,944 cars so far this year, up by 5.3 per cent. Only Ford, which holds spot number five has recorded a drop, with 69,081 vehicles moved, down more than 11 per cent on the 78,161 units sold last year.

It's bad time to be a former maker of Australian cars, it seems, with Holden, which lands in sixth place, continuing its horror run, having shifted only 60,751 cars in 2018, down more than 32 per cent on the same period last year.

But you only need to look at the top selling cars in Australia to find out where the mainstream growth lies. Of our top-10 models in 2018, not one was a full-size sedan (unthinkable, even a decade ago), and just three passenger cars in total. We have now entered the era of light-commercial vehicles and SUVs. The passenger car is, if not dead, then dying.


The Toyota HiLux (a whopping 51,705 sold so far this year) and the Ford Ranger (42,144 sold) hold positions one and two. The Toyota Corolla and Mazda3 held sports three and four, while the Hyundai i30 holds position five.
The Mazda CX-5 sat in position six, and is the first SUV to appear in the top 10, with the Mitsubishi Triton, Toyota RAV4, Nissan X-Trail, and Hyundai Tucson rounding out the list.
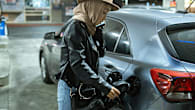
How many electric vehicles (EVs) are sold in Australia each year
The short answer? Not many. While it's true that our market will soon be flooded with new electric options (inlcuing the Mercedes-Benz EQC and Audi e-tron), there are only a handful of brands in the space right now. The lion's share of sales are absorbed by the Tesla Model S and X (and, shorlty, the 3), but with the Silicon Valley brand unwilling to publicly disclose its local sales figures, we can't tell you exactly how many have found homes in Australia.
The Renault Zoe attracted just 48 sales in 2018 - and shifted just two vehciles in the first four months of 2019 - while Jaguar's I-Pace EV SUV found a home with 47 buyers in the first four months of the year. Pure electric sales of Hyundai's Ioniq - which is available in hybrid, plug-in hybrid and EV - make up around 50 per cent of that car's totals, and with the Kona Electric just launched, the Korean brand's EV footprint will only grow. BMW, the first premium brand to offer an EV, managed 115 sales of its i3 in 2018, and 27 in the first four months of this year.
But while the numbers are a tiny portion of the overall market, that percentage is growing. According to official VFACTS data, some 1336 electric vehicles found home - be they public or private - in 2018. This year, however, more than 900 EVs were sold between January and April.
Used car sales statistics Australia
The question is, does all this new-car action have an impact on the used vehicle market? Is it suddenly flooded with near-new models as buyers rush to upgrade their wheels? Or is it sitting stagnant?
It's hard to decipher an accurate answer on that. Though amazingly, ABS data released in January this year found the average age of an Australian car to be 10.1 years old - a number unchanged since 2015, despite the number or new cars sold.
In terms of how many used cars are sold in Australia every year? US auto analysts Manheim found the size of our second-hand car market to be around three million units per annum.
.jpg)


.jpg)


.jpg)
.jpg)


.jpg)